
Crucial Startup Metrics for B2B vs. B2C Products: What You Need to Track

TL;DR
Startup Metrics Tracking the right KPIs early is the difference between “flying blind” and scaling with precision. Whether B2B or B2C, metrics should be simple, strategic, and free from “vanity” bias.
B2C Focus (Growth & Virality):
- Growth: Aim for 10-15% MoM user increase.
- Loyalty: Target an NPS of +50 (Monzo hits +75).
- Economics: Monitor the Payback Period to ensure sustainable acquisition.
B2B Focus (Retention & Revenue):
- Revenue: MRR is your North Star.
- Efficiency: Net Dollar Retention should exceed 100% (upsells must beat churn).
- Survival: Keep a close eye on Burn Rate and Runway to manage cash flow.
The Goal: Don’t get lost in hundreds of data points. Choose 4-5 core metrics that validate your product-market fit and guide your decision-making from day one.
Understanding and leveraging key product metrics is essential for the success of any startup.
While both B2B (business-to-business) and B2C (business-to-consumer) companies must track their performance meticulously, the specific startup metrics they focus on can differ significantly.
Here’s a comprehensive guide for the growing startups to the most important startup metrics for both B2B and B2C, along with some tips on how to track them more efficiently.
Fundamental Metric Principles for Every Startup
Regardless of whether your startup is B2B or B2C, there are some common principles you should pay attention to while tracking your metric.
Start Early
Incorporate basic startup KPIs before launching your product.
This approach supports informed decision-making from the start and is one of the key product launch best practices.
Many founders launch their products without basic product metrics for startups in place. Setting up the right tracking infrastructure from the start is exactly what product analytics services help you do — before you’re scrambling post-launch. Post-launch, they find themselves scrambling to gather and analyze data, realizing they were essentially flying blind.
On the other hand, some founders overdo it by setting up hundreds of metrics even before they have substantial user data. This approach can lead to analysis paralysis and unnecessary complexity instead of rapidly validating product ideas.
Here is why you should find a balance by being strategic and intentional, and let’s check how to do it.
Keep It Simple
Initially, focus on four to five key product metrics. Too many can lead to confusion and lack of focus. It’s crucial to choose an easy-to-use analytics solution and ensure your team agrees on the definitions of these metrics. Consistency in definitions prevents internal conflicts and keeps everyone aligned.
A quick look at solutions: the market now offers a wide range of options, with leading choices including Google Analytics, Mixpanel, Heap, Amplitude, and others.

Choosing the right tool is essential for accurate tracking and analysis, ensuring you gain valuable insights into user behavior and product performance. Consistency in how metrics are defined and tracked across your team is key to making data-driven decisions.
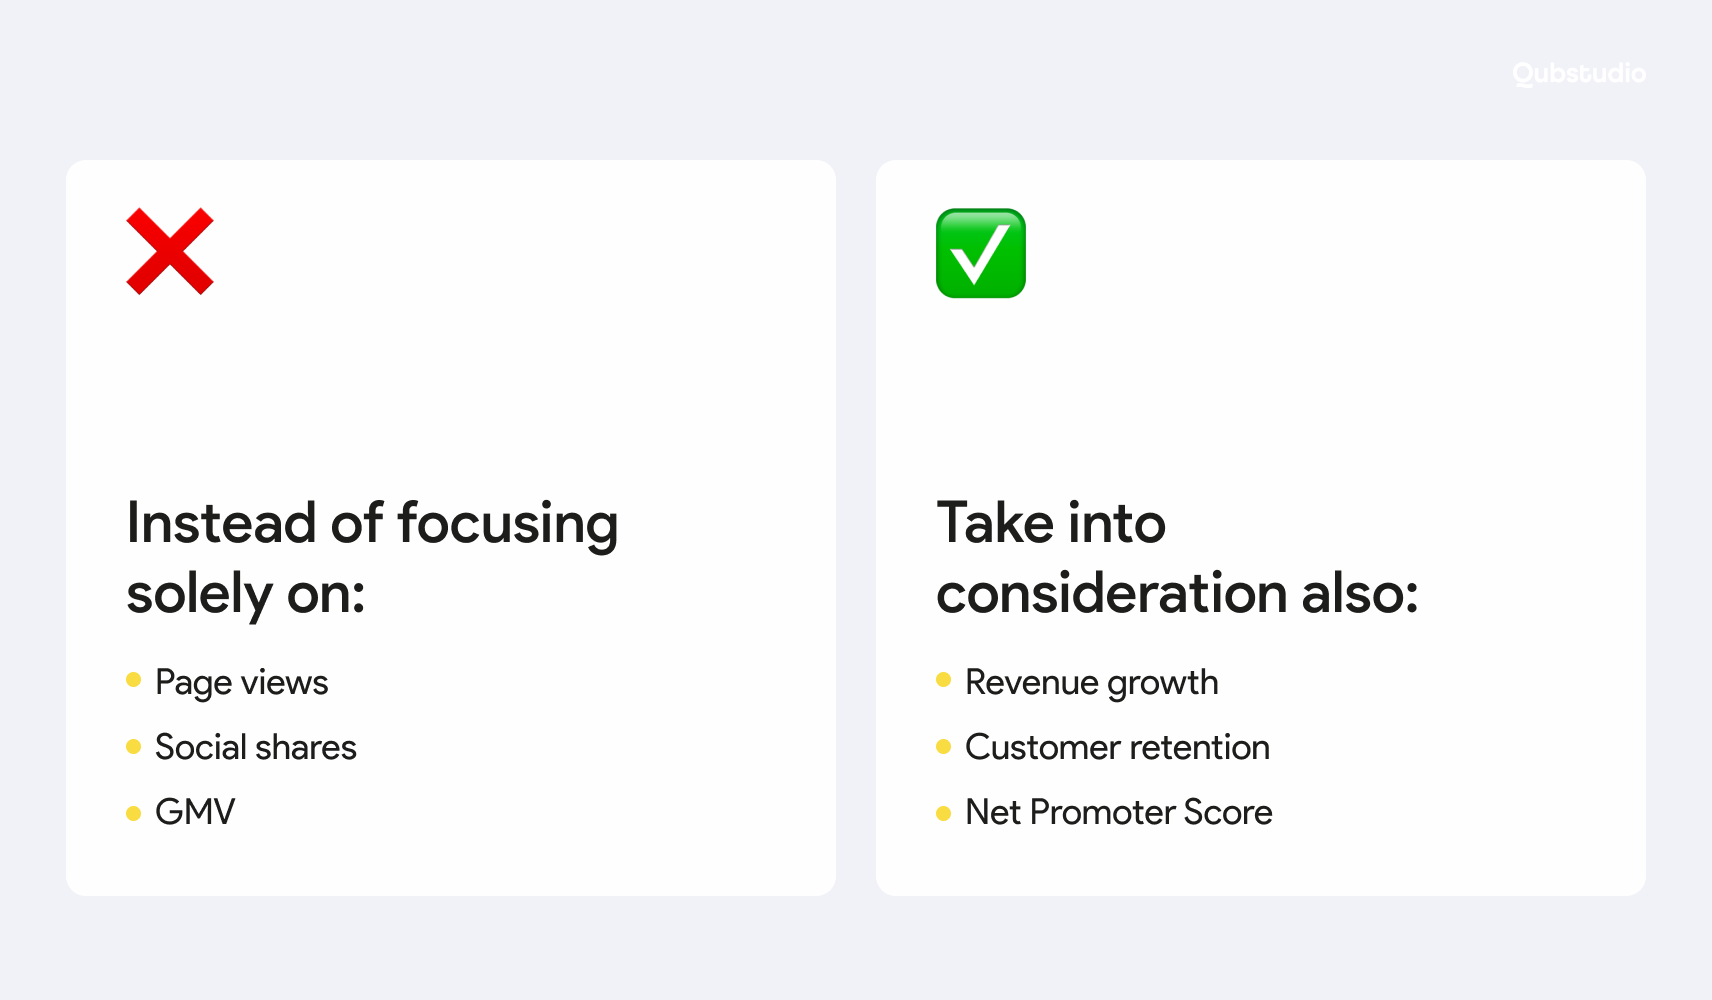
Avoid Vanity Metrics
Avoid product KPIs that may look impressive but don’t directly correlate with measuring product or business success, as they can lead to misleading conclusions and distract from true performance indicators. Focus on meaningful metrics and real key performance indicators for startups that reflect the actual health and growth of your business.
Metrics like page views or gross merchandise value (GMV) often present misleadingly large numbers that don’t directly correlate with business success. For B2B companies, revenue should be the primary metric. Others might mislead and cause teams to optimize for the wrong goals.
Balance Data and Intuition
While metrics are important, they should not replace customer interactions and product intuition during a startup product validation. Get out of the building and talk to your users to understand their needs and feedback.
As custdev and user research is another science (and probably even an art) we are not focusing on the methodology of talking to users in this article. We explored this topic here.
The choice of metrics and measuring product success depend on the business model. Therefore, let me categorize the metrics into two groups: B2C and B2B startup metrics.
This approach simplifies the complexity of real-world business models (which also include marketplaces, sharing economy, C2B (Consumer-to-Business), B2G (Business-to-Government), D2C (Direct-to-Consumer), and others), but still seems a worthy basic classification.
Key Startup Metrics for B2C Products
For B2C startups, tracking the right growth metrics and KPIs is essential for scaling successfully.
These metrics help measure customer acquisition, retention, and overall product performance. By focusing on key startup KPIs, you can make data-driven decisions to optimize growth and product-market fit.

User Growth
User Growth measures the increase in the number of users or customers over a specific period. It helps track the effectiveness of marketing efforts, product appeal, and overall market demand.
It is a primary metric for B2C companies. Building a substantial user base is often critical before monetization strategies are fully developed.
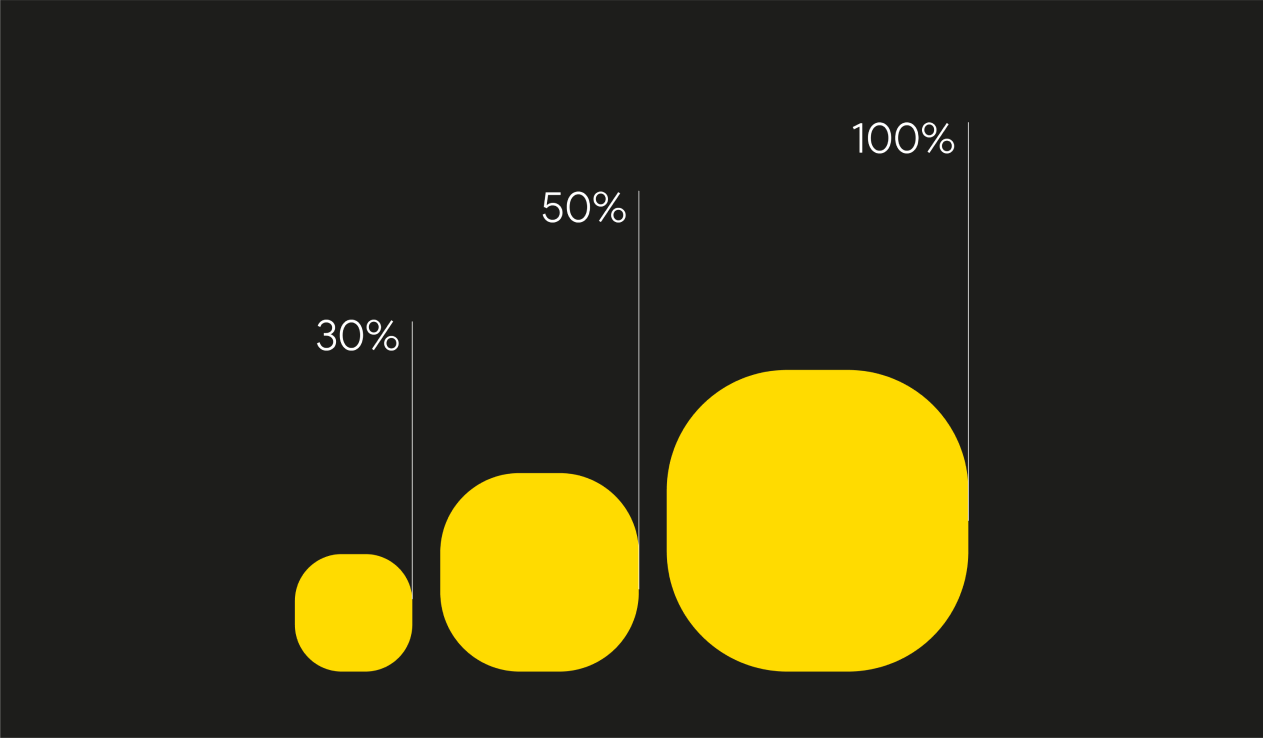
Depending on the industry, these metrics can vary significantly. However, for a startup aiming to grow, it is reasonable to consider the following benchmarks:
- 15% Monthly Growth is indicative of strong potential, leading to a 5x user increase annually.
- 10% Monthly Growth is solid, resulting in a tripling of the user base each year.
- 5% Monthly Growth may be too slow to achieve significant breakout success.
Organic vs. Paid Growth
Organic growth refers to the natural increase in users or revenue that occurs without relying on paid advertising or external investment. It is particularly crucial for consumer startups and their startup metrics. Paid growth involves direct spending on user acquisition, such as ads. Organic growth is created through virality and network effect.
Virality: Users sharing the product naturally, such as Facebook’s photo tagging or Wordle’s social media shares.
Network Effect: The product becomes more valuable as more people use it.
Aim for a substantial portion of growth to be organic, as reliance on paid growth can be costly and unsustainable.
Unit Economics
Unit economics refers to the direct revenues and costs associated with a single unit of product or customer. It helps you understand the profitability of each customer or transaction.
Here are some key formulas to calculate your unit economics:

1. Customer Acquisition Cost (CAC)
CAC is the total cost a business incurs to acquire a new customer, including marketing, sales, and other related expenses.
CAC = Total Cost of Acquiring Customers / Number of New Customers Acquired
2. Customer Lifetime Value (CLV or LTV)
CVL or LTV is the total revenue a business can expect from a customer over their entire relationship with the company.
CLV = Average Purchase Value × Average Purchase Frequency × Customer Lifespan
Where:
- Average Purchase Value – the average amount spent per transaction.
- Average Purchase Frequency – the average number of transactions per period (e.g., monthly, annually).
- Customer Lifespan – the average duration a customer stays with the company.
3. Gross Profit per Customer
Gross Profit per Customer is the amount of profit a business makes from each customer after subtracting the direct costs of goods or services sold.
Gross Profit per Customer = Revenue per Customer − Variable Costs per Customer
4. Contribution Margin per Customer
Contribution Margin per Customer is the portion of revenue remaining after variable costs that contribute to covering fixed costs and profit.
Contribution Margin = (Revenue per Customer – Variable Costs per Customer) / Revenue per Customer
5. Payback Period
The Payback Period is the time it takes for a business to recover the cost of acquiring a customer (CAC) through the revenue generated from that customer.
Payback Period = CAC / Gross Profit per Customer per Period
Where Gross Profit per Customer per Period is the profit earned from a customer in a specific time frame (e.g., monthly or annually). It indicates how quickly a business can break even on its customer acquisition efforts.
A shorter payback period is ideal, as it allows the business to reinvest the recovered costs into acquiring new customers or scaling operations, contributing to faster growth and profitability.
6. CLV to CAC Ratio
The ratio of Customer Lifetime Value to Customer Acquisition Cost. It helps evaluate the return on investment for acquiring customers. This metric is crucial for assessing the long-term profitability and sustainability of a business.
A ratio greater than 1 indicates that the value of a customer exceeds the cost of acquiring them, suggesting a positive return on investment. A low ratio may signal that acquisition costs are too high or customer retention needs improvement.
These formulas provide a comprehensive view of the unit economics of a B2C startup, helping to evaluate profitability, cost efficiency, and overall financial health.
Retention
Retention metrics indicate how well your product retains users over time. It is among the most important success metrics for new products.
Defining “active users” is key, such as Monzo’s definition of an active user as one who made at least one financial transaction per week. Identifying “magic moments”—behaviors that predict long-term retention—can also drive success, like Facebook’s finding that users who added seven friends in their first 10 days were more likely to stay.
Net Promoter Score (NPS)
NPS measures customer satisfaction and loyalty.
To better understand its significance, it’s helpful to look at benchmark scores from leading companies across various industries.
- A minimum NPS of +50 is ideal for consumer startups. Monzo achieved a score between +75 and +80, while Chime (Financial Services) has achieved scores in the +50 to +60 range.
- Airbnb often scores around +40 to +50 and Apple typically scores around +60 to +70.
Also, it’s important to keep the method of asking for NPS consistent to avoid skewed results.
If you’re looking to dive deeper into how user insights can drive business growth, check out our recorded webinar — “How to Grow Your Product Through User Insights”.
During the webinar, we explore product analytics, key metrics, and the best tools to turn user data into actionable strategies for boosting product performance.
While the growth metrics for B2C startups focus on user growth and engagement, B2B startups face a different set of challenges and priorities. In the B2B space, metrics often center around customer acquisition, retention, and the long-term value of business relationships.
Let’s check it out in more detail.
Key Startup Metrics for B2B Products
In the B2B space, metrics often focus on long-term value. The key indicators help businesses measure growth, optimize operations, and ensure sustainable success when working with other companies. Let’s dive into B2B startup metrics in more detail to see how they can guide your business to success.

Revenue
Revenue is often the most critical metric for B2B companies. It reflects the company’s ability to monetize its product or service.
Here is a simple example of revenue counting for a SaaS Product. Let’s check metrics for calculation:
- Monthly Subscription Fee: $500 per business client
- Number of Business Clients: 50
- Total Sales Revenue: $25,000 (50 clients * $500)
- Returns and Discounts: Assume minimal, so no returns, but $1,000 in discounts
- Variable Costs per Client: $150 per client (includes costs like cloud hosting, customer support, etc.)
- Customer Acquisition Cost (CAC): $2,000 per client
- Customer Lifetime: 24 months on average
Let’s break it down. First, we look at Gross Revenue, which is the total income you generate before factoring in any deductions like discounts or returns.
Gross Revenue = Monthly Subscription Fee x Number of Business Clients
Calculation: in this case, you’re charging $500 per month for each of your 50 clients. So, your Gross Revenue is: $500 × 50 = $25,000
But not all of that will be kept as is. There’s a $1,000 in discounts you’ve offered to your clients, so to calculate your Net Revenue, we subtract the discounts from the gross total:
Net Revenue = Gross Revenue − (Returns + Discounts + Allowances)
So, the calculation is: $25,000 − $1,000 = $24,000.
Retention
Retention plays a crucial role in B2B as well, as maintaining long-term relationships with clients is key to ensuring sustainable growth and maximizing lifetime value.
An advanced metric such as the Net Dollar Retention indicates growth or decline in revenue from existing customers.
A rate above 100% signifies that upsells and expansions outweigh churn.
Gross Margin
Gross margin is your revenue minus the cost of goods sold, and it’s essential for understanding profitability.
In other words, the percentage of revenue remaining after deducting the cost of goods sold (COGS) or variable costs.
Gross Margin = ((Revenue – COGS) / Revenue) x 100
For software companies, variable costs might include cloud services or AI model usage.
Customer Acquisition Cost (CAC)
Track the cost per active, monetized, and retained user. The metric I previously mentioned in the B2C metrics section, it remains the same. However, for B2B consider the two best practices:
- Tracking: Use UTM parameters (tags added to the end of URLs) or ask users where they heard about your product.
- Optimization: Focus on acquiring users who stay and generate revenue, rather than just increasing signups.
Burn Rate and Runway
These metrics indicate how long your company can sustain its operations with the current cash flow.
- Burn Rate: The difference between monthly costs and revenue, indicating how quickly your company is spending its cash.
- Runway: Indicates how many months your startup can continue operating before running out of money.
B2B startups should prioritize metrics that emphasize growth, efficiency, and retention, enabling data-driven decisions for sustainable, scalable success. Here’s a brief recap of the key metrics we covered earlier:

Conclusion
Both B2B and B2C startups should carefully choose and track the right growth metrics to guide their decision-making processes.
By focusing on these key startup metrics and adhering to the general principles outlined, startups can navigate their journey more effectively, ensuring sustainable growth and long-term success.
Whether you’re driving consumer engagement or building business relationships, the right metrics provide the roadmap to your startup’s success.
If you need help setting up or refining your growth metrics, feel free to reach out to Qubstudio — a digital product design agency & strategic design partner — for expert guidance.
FAQ
What are the most important startup metrics to track for early-stage companies?
Early-stage startups should focus on three core areas: User Growth, Retention, and Unit Economics.
For B2C, a monthly growth rate of 15% is a key benchmark.
For B2B, the focus shifts to Monthly Recurring Revenue (MRR) and Net Dollar Retention (NDR), which ideally should be above 100% to indicate that existing customers are increasing their spending.
Explain the difference between Burn Rate and Runway for a new business.
Burn Rate: The net amount of cash a startup spends each month to cover operating costs (total costs minus revenue).
Runway: The number of months a company can continue operating before running out of cash. It is calculated by dividing current cash reserves by the monthly burn rate. Understanding this gap is critical for timing the next investment round.
How do top startups measure and improve their churn rate effectively?
Startups measure churn by tracking the percentage of users or revenue lost over a specific period. To improve it, they analyze Retention at different intervals (Week 1, Month 1, Year 1).
By identifying where users drop off, companies can optimize the onboarding process or add features that increase the product’s “stickiness” and long-term value.
What are standard churn rates for B2B subscription services?
In B2B, stability is key. While benchmarks vary, top-performing B2B startups aim for high Gross Margin and an NDR above 100%. A “healthy” churn rate in B2B is generally lower than in B2C because enterprise contracts are longer and the cost of switching is higher.
Startups often use the Net Promoter Score (NPS), aiming for +50 or higher, as a leading indicator of potential churn.
What is a healthy LTV to CAC ratio for a growing startup?
A CLV (Customer Lifetime Value) to CAC (Customer Acquisition Cost) ratio greater than 1:1 indicates that a customer is worth more than the cost to acquire them. However, for sustainable scaling and attracting venture capital, many successful startups aim for a 3:1 ratio or higher.
How is the "Payback Period" calculated in unit economics?
The Payback Period is calculated by dividing the CAC by the Gross Profit per customer per period. This metric shows exactly how many months it takes for the business to recover the initial investment made to acquire a new customer. A shorter payback period allows a startup to reinvest cash into growth more quickly.