How to measure UX design ROI

TL;DR
UX design ROI can be measured through specific metrics and formulas—the 1-10-100 rule applies: a problem costing $1 at design stage costs $10 in development and $100 after launch.
Key Reasons to Calculate UX ROI:
- Reduced long-term costs through accurate research
- Increased sales via eliminating buying journey friction
- Increased productivity
Internal UX ROI Metrics:
- Conversion Rate
- Drop Off Rate via Google Analytics and Hotjar
- Single Usability Metric (SUM)
The Article Goal: To provide you with proven metrics, formulas, and case study examples for calculating UX design ROI—covering both profit increase and cost decrease opportunities to make data-driven design investment decisions.
Measuring the invisible. That’s what many business owners feel when they try to measure the ROI of UX design services. What if we told you that there actually are metrics, formulas, and approaches to prove whether your design works or not?
This article is a bit of a longer read, so you might want to press Ctrl+D (or Cmd + D) and add it to bookmarks if you’re short of time and want to know how to calculate the profit from UX design.
What is the ROI in UX?
Talking about the ROI (return on investment) of anything, we’re talking about the balance of the income (return) and economy(investment). It’s not only about making more revenue but also about preventing risks, saving costs in the short and long run.
Metaphorically speaking, if you want to see the Northern light, you’ll have to look for it at the right time, in the defined area, and in many cases, using the special gear. To mess with all that, you need ability and motivation.
We’re going to chase the ROI for UX design by following a somewhat similar way. We’ll start with finding out the exact reasons to go the hard way of calculating things that are not too visible at first sight. Then move on and find out which stages of product development are the right ones to look out for the ROI. And finally, get to the ‘how-to’ tactics that will guide you to where the ROI shines. Or doesn’t shine. But at least you need to know about it, right?
Reasons to Calculate ROI for UX
While the user experience value might seem obvious to many, it makes sense to dig and find out why it actually matters.
Reduced long term costs
One of the most underestimated ROI factors is how much are you going to spend solving clients’ problems after the product launch. If you’ve researched your market thoroughly, created accurate, data-driven customer journey maps, the users are going to stumble upon problems less often. This means you’ll need to spend less on resolving users’ issues on calls, via emails, support tickets, etc. It may not seem like massive trouble at first when the amount of users is small. As your product grows, it would be too late and way more expensive to run a re-design and re-development.
Increased sales and conversions
If it doesn’t sell, it’s not creative. This is a crucial thesis, especially when it comes to marketplace and e-commerce design. UX and marketing have a lot more in common than it seems at first. Both rely on human behavior principles that stimulate the desired decisions and actions. You certainly don’t want to invest in marketing campaigns and have your perfect clients leave because they got confused at one of the buying steps.
Sales blocks and confusion on the buying journey can be eliminated at the research phase design and by following the industry design best practices. Better results can be achieved by involving a proficient UX/UI design agency. Further, these are watched out for during the usability testing phase.
If at this stage you notice that the number of shopping carts with items and no purchases, or unfinished sign-ups is a noticeable business loss – it’s time to review the current state of your UX.
Increased productivity
Your employees are always your target audience. Period. And it’s the audience that’s neglected most often. By investing in UX for your employees, you return yourself the benefit of saved working hours, employee retention, and effectiveness (no one is satisfied with a monkey job, right?). Which means to you that you can either use the saved time.
Susan Weinschenk, Chief of UX Strategy at Americas Human Factors International, reports that half of software developers’ time is spent doing work that could be avoided. Your goal as a business owner is to make every minute your employees spend count and bring value to your organization.
Let’s now take a calculator and see if the investment in designing for employee productivity is worth it:
(Hours the avoidable activity takes per week) * (Employee rate per hour) * (№ of employees doing the avoidable activity) = Production savings per week
Suppose 5 employees ($43 per hour rate each) spend 1 hour a day filling in the data that could be automatically copied and pasted:
(7 Hours per week) * ($43 per hour) * (5 Employees) = $1,505 per week
Now let’s do the yearly count: (49 working weeks) * ($1,505 productivity loss) = $73 745
And that’s just about saving 1 hour per day by improving 1 feature of UX for your employees. In reality, when Oracle improved the navigation structure of their CRM, enabling managers to complete tasks 20% faster.
Reduce Development waste time
Fixing a UX issue after the development is over will cost you much more.
Studies have shown that 40 to 50 percent of their employees’ time is spent doing an avoidable rework rather than doing what they call value-added work.
The 1 – 10 – 100 Rule can relate to the role of UX design in digital product creation.
In a nutshell, it means that a problem that could be corrected for $1 at the design stage would cost $10 in the development stage and $100 after the product is unsuccessfully released.
Though it’s a well-known rule in product management, these numbers seem to have somewhat symbolic values in UX.
Instead, let’s make a real formula that you can use to forecast and calculate the ROI design brings by avoiding risks:
(№ of UX issues) * (Average fix time in development) * (Developer’s average hourly rate) * (№ of Developers) = Price of UX issues
A successful example that proves American Airlines performed the theory.
They fixed usability issues at the design stage of their website and reduced the cost of those fixes by up to 90%.
Long term user loyalty and retention sales
With advertising platforms like Google and Facebook, it becomes more and more expensive to bring new clients with paid advertising only. This means that the value of an existing client is getting higher than ever before.
The first thing you’d want to do in this reality is to increase the average lifetime value (LTV) that an existing client brings. It brings you to 2 key sales metrics: increasing the average conversion value and increasing retention.
With these metrics in mind, building a UX customer journey map will be much more productive, and the new UX design will score a higher ROI on your A/B testing stage.
When to calculate ROI?
As UX is a part of the business process, its task is to think of business value from start to finish, and after the finish.
It’s more accurate to calculate the ROI of your UX activities when your project already has a financial history. But what’s important is how and when do you decide if you need a new UX?
Pain in the check. You see a usability problem that costs your business money. Often that’s one of the most sure-fire ways to make more money.
You see the future. While researching your users and you noticed there are more ways to fix their pain-points better.
Once you find yourself thinking in at least one of these directions, there are a couple of questions to ask yourself:
- What’s the cost to build the entire UX first?
- How much more it costs you comparing to the way you designed before?
- What would be the cost to fix the UX after the main development is over?
- What would be the lost opportunity cost if the UX design firm working for you isn’t right?
- How much time will you need to get your investment in UX returned?
- How much money will it make you in the first 6 months, 1 year, 2 years?
Map out what your goals and current state of things are, compare these to the cost of UX to fill the gap between where you are and where you want to be. Numbers will guide you.
The ROI metrics of UX and how to calculate ROI.
Is there a vast, complex formula that you can master to set up the calculation of ROI for any business?
Money is the answer, but that would be quite general and superficial. So, nope, there is no single performance indicator.
Luckily, there are proven ways to calculate their ROI for UX. We’re going to dwell upon the internal characteristics of your product that influence your users’ behavior.
This list doesn’t include external marketing characteristics like demographics, traffic source (well, this one is a little tricky, but it’s still not today’s topic), interests, location because marketing efforts mostly influence them.
Think of these internal UX ROI metrics as ingredients for your cocktail (I’d call it ‘MargaROItta’):
Conversion Rate
The holy grail of all sales goals, which defines what percentage of users completed your desired action like subscribe to a newsletter, channel or purchase a product or service.
There are optimization campaigns built around conversion rates only.
Most of the analytic and advertising tools calculate conversion rates automatically. But, in reality, it’s about choosing the winning set of design and content elements. While optimizing your website or application for conversions, you’ll be surprised at how even a minor change in the button’s color, dimensions or location can influence the click-throughs.
Let’s quickly go over one of the case studies from Qubstudio portfolio:
We were invited to make a redesign for Gastroli.ua. Our starting point was a 70% bounce rate and a 3% conversion rate (ticket purchase).
While performing a UX review of the existing service, we found out 3 main areas that caused the low results:
- The uncomfortable flow of picking, order and buying a ticket. Especially on mobile;
- A large number of tickets added to the cart, but a small amount of actually paid tickets;
- Uncomfortable event search.
By performing a UI/UX redesign for the online platform, we were able to decrease the bounce rate from 70% to %40, which was the first step to increase conversions.
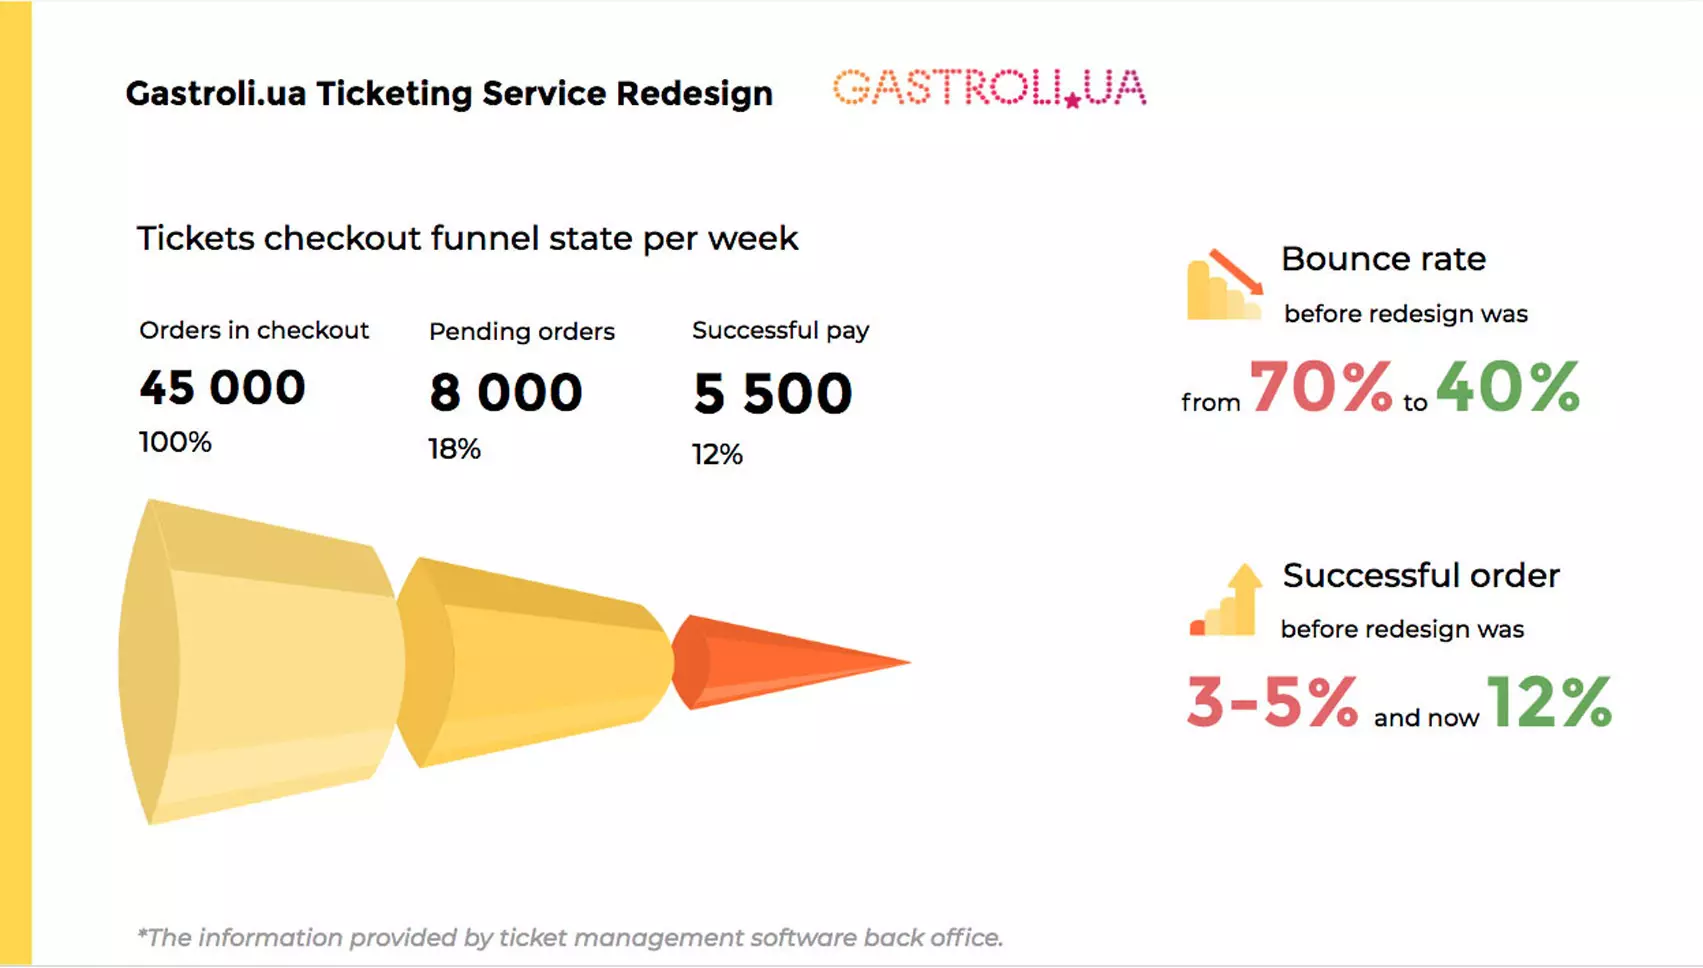
We also found out that too many carts with tickets already in them didn’t get paid, which leads us to the average 3% conversion rate. By spotting the drop off places and further redesigning, testing and optimizing the purchase flow Gastroli.ua and Qubstudio reached a 12% conversion rate (based on 5,500 successful orders), which means that before the redesign, the company was losing 9% of their sales.
Now, let’s try and pull out a conversion formula for ROI from this case.
For the sake of NDA and easier calculations, let’s put sample numbers.
100 website or app users/day
30% don’t convert into sales because of a UX issue in the cart
30 missed sales a day, with a $10 margin each is lost.
30 (sales) * $10 (margin) = $300/day:
300 x 365 = $109,500/year loss
Now, what do you think would be a fair price to fix this UX issue?
Typically, UX agencies charge way less than half of the result produced the first year. Often it’s not even 1/4th of the result.
Drop Off Rate
Drop off rate measures the percentage of people who left your funnel at a particular stage before completing a conversion. Drop off rate is also known for being confused with the bounce rate mentioned in the previous example.
The fundamental difference between the drop off rate and bounce rate is that the bounce rate only measures users leaving after seeing the first screen.
The most widely used tools that give insights into the drop off rates are Google Analytics and Hotjar. Both are an absolute must with any UX work in progress.

Drop off rate gives more information about User Experience, as it represents a behavior map that shows the percent of users leaving during each step of the conversion funnel. This helps to identify the main points of user dissatisfaction or confusion. In the case with Gastroli.ua fixing the issue with a high drop off rate on the checkout page was crucial to increasing conversions.
Single Usability Metric (SUM)
If you’re a product manager, you’ll frequently use system usability compiled of multiple metrics to make product release and design management decisions. SUM consists of standard efficiency, productivity, and satisfaction definitions and typically includes time spent per action and satisfaction levels.
Most often, time spent on completing a task, success rate, and satisfaction rate is the metrics that make up how a single usability metric is calculated. However, it’s essential to understand that a particular product can have a set of target metrics of its own. In this case, these target metrics will make the Single Usability Metric.
If the value of each target metric (like bounce rate, completion rate, satisfaction rate) is equal, the most accurate way to calculate the SUM is to take a geometrical mean:
√(X bounce rate + Y Satisfaction Rate + Z Completion rate) = Single Usability Metric
If the value of a certain metric differs from others on your project, you’d want to add this to your calculations before measuring the overall success of your design.
For example, if you’re in dynamic e-commerce, the success (purchase) rate would possibly have a higher priority than that of the satisfaction rate. Let’s say, you’re going to value satisfaction 50% less. In this case, your steps will be as follows:
- calculate each metric;
- multiply Satisfaction rate by 0,5;
- run the geometric mean formula above.
Average Order Value
Previously we’ve mostly spoken about how often you sell or convert. Now it’s time to see how well your new UX makes people want to buy more.
While going for better conversion rates typically requires going towards the purchase faster, increasing Average Order Value (AOV) would require giving more options to the client.
When this process contains a poor UX, it can seriously harm Conversion Rates and appear more as a distraction.
Average Order Value is revenue made divided by the number of purchases.
Let’s now do simple math:
The old AOV was $100 with 10 sales a day.
New UX raised the AOV by 10%; (which equals $10)
The new AOV is $110
The cost of UX design for this metric was $5,000
Daily return on UX design update would be: $10 New AOV Increase * 10 Number of Sales a Day = $100
The added profit of improved AOV would be: $100 daily * 365 = $36,500
$36,500 is +730% return on $5,000 investment.
User Retention Rate/ Lifetime Value
A good UX makes people want to return for more. That’s because people naturally tend to choose something positively familiar. Possibly, the main reason why we survived in the wild:)
Increasing User retention rate does not only enhance conversion rate and average order value but also saves Customer Acquisition Costs from your marketing budget.
Both these factors make this metric one of the most significant profits of UX design. According to Bain & Company, recent research, improved User Retention Rate can 3x the overall business value.
To measure the retention rate, you need to define the timeframe of what you consider a return. This will depend on many external factors like, events, seasons of the year, location, and more depending on your business specifics.
Once you define a monthly/quarterly/yearly retention timeframe, time to calculate the percentage. To do this, divide the number of converted customers by the amount of the ones who returned at least once.
One of the strong UX ROI examples is Staples for redesigning their e-commerce website and increasing repeat sales by 67%. Impressive, isn’t it?

A decrease in Calls to Helpdesk/Support Cost per User
Every time a user stumbles upon a UX mistake, he/she would either abandon the session or address support to resolve the issue. Each support ticket or support call requires time resource (and his hourly rate, of course) of a helpdesk employee.
For a dynamic startup of 5 employees, who just got a bump of traffic and new 1,000 users, this could be a shot in the back and cause severe financial and reputational harm.
Correcting the UX errors that cause support tickets or calls when the product is launched could be even more expensive than handling the support center.
That’s why investing in a UX that allows users to find information and rely less on your support employee effortlessly would save you costs and prevent the support/UX fixes loop.
While working Exalate plugin for Jira, Qubstudio identified 12 most crucial User Flow issues during UX review. Fixing these issues decreased the number of helpdesk requests by 45% shortly after the updated version launched.
Here’s a great calculator that you can use to evaluate the potential ROI of a decrease in support cost per user:

Reduction in training
Most people hate reading instructions (ed. including the author of the article).
The better training documentation and experience is, the less time & resource is needed to perform the training.
While external B2C consumers aren’t likely to purchase products that require training, this is often an issue in more complex SaaS and B2B products.
ROI Calculators to Use
Considering the number of variables included in the UX process, most likely, no ready-made calculator would fit the needs of a project 100%. For the best results, we recommend to learn your business and be able to create your calculations. However, ‘human factors’ have a free and decently built UX ROI calculator that you can access here:
http://humanfactors.com/coolstuff/roi.asp
Don’t forget that the calculator doesn’t know your business. After all, it’s just a tool in the hands of an entrepreneur.
What to Do with Results
Getting positive ROI gives you a green signal to grow. We recommend going ahead by running multivariable tests whenever any external marketing factors change. But that’s a whole other story. Generally speaking, once you’ve proven the UX concept of your product, you’re ready to start scaling.
Using ROI to Plan Your UX Work
UX and Marketing strategies have always been walking together. Now that you know how you can calculate the efficiency of UX, it’s time for you to decide:
- Based on your domain experience, improvements in which metrics will give you the most money-related profits?
- How will new UX be implemented?
- How will new UX align with your current product strategy?
Deciding on target metrics and goals, learning your current audience behavior trends will save you precious time on the project. And therefore, money.
Conclusion
The process of increasing UX ROI is about learning and anticipating your users’ needs in-depth. During the UX design process, even giant players find out new insights into their activities and leverage these to stand out from the competition and create unforgettable customer experiences.
While planning the UX design for ROI, always look for opportunities both in increasing profits and decreasing costs.
Do make sure your marketing and UX strategy align and that every member on your UX design team understands both. This will save you from confusion and avoidable rework.
And possibly the most useful piece of advice here: do choose design teams with precision.
Have a project to design and profit from?
Drop Qubstudio a line here.
FAQ
What is UX design ROI?
UX design ROI is the balance between return and investment—not only more revenue, but preventing risks and saving costs short and long term. It covers increased conversions, reduced support costs, eliminated development waste, and higher employee productivity.
The right moment to evaluate: when you see a usability problem costing money, or when research reveals better ways to address user pain points.
Why does poor UX cost significantly more to fix after launch?
The 1-10-100 Rule defines the relationship: a problem corrected for $1 at design stage costs $10 in development and $100 after release. American Airlines proved this—fixing usability issues at design stage reduced fix costs by up to 90%.
Which UX metrics directly measure design ROI?
Six metrics form the core measurement framework:
- Conversion rate—percentage of users completing desired actions
- Drop-off rate—where users abandon the funnel, tracked via Google Analytics and Hotjar
- Single Usability Metric (SUM)—efficiency, productivity, and satisfaction combined
- Average Order Value—a 10% AOV improvement on a $5,000 UX investment can yield 730% return
- User Retention Rate—Bain & Company confirmed improved retention can triple overall business value
How does investing in employee UX reduce operational costs?
Susan Weinschenk, Chief of UX Strategy at Human Factors International, reports half of software developers’ time is spent on avoidable work. Oracle improved CRM navigation, enabling managers to complete tasks 20% faster.
The formula: (hours avoidable activity takes per week) × (employee rate per hour) × (number of employees) = weekly savings. Saving one hour daily for five employees at $43/hour equals $73,745 per year from a single feature improvement.
How does better UX reduce support costs and improve retention?
Every UX mistake produces a support ticket or abandoned session. Investing in UX that helps users find information independently prevents the support-UX fixes loop.