What Do Your Product Growth Metrics Tell You? Benchmarks Across Industries

In 2023, an estimated 328.77 million terabytes of data were generated daily. This abundance of data is a treasure trove of information. However, separating the signal from the noise is challenging.
How can we effectively navigate the oceans of data and distinguish between good and bad results? The answer lies in comparison.
Benchmarks enable product builders to assess their products’ performance relative to industry trends and top performers. They help us understand what good performance looks like and how it differs from great performance. In this article, I will discuss insights and trends from the Mixpanel Benchmark Report across various industries.
If you’re a digital product professional—whether you’re a startup founder, CEO, or growth expert—this article is a must-read. Let’s dive into industry benchmark insights that can help you decode and leverage your product growth metrics.
Why To Use Industry Benchmarks?
Benchmarks are not static. They evolve as companies innovate and technology disrupts the status quo.

What was considered “good” growth product metrics last year might not hold true next year. Benchmarks provide a current comparison and a roadmap toward higher performance in the years to come.
So, how can you make sense of the overwhelming number of data points?
Let’s explore industry benchmarks across various metrics and sectors, and then distill that information into clear, actionable summaries.
User Acquisition Metrics Benchmarks
Acquisition measures how many new users a product gains over a period, typically expressed as a percentage change in daily active users (DAU) and monthly active users (MAU).
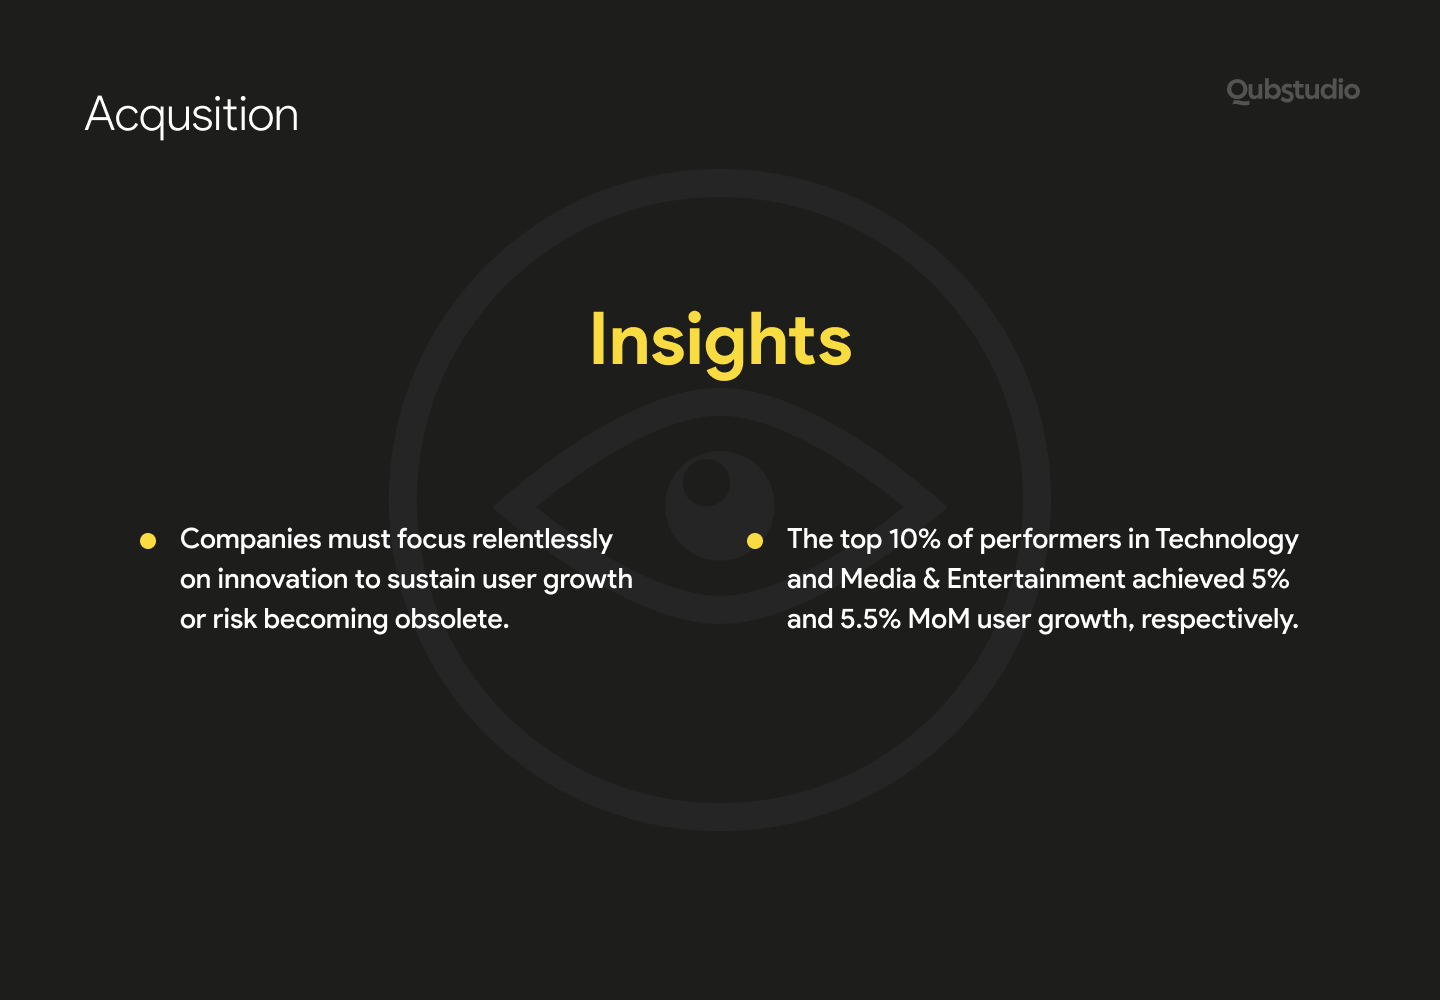
By tracking acquisition through MAU and DAU gains, product experts can determine if their user base is growing. Companies in competitive sectors must focus on innovation to maintain user growth or risk becoming obsolete as others outpace them with more exciting products.

Active user growth increased in most industries, with e-commerce seeing the highest year-on-year rise from 2% to 3.5%. Conversely, Technology and Media & Entertainment experienced declines, with technology contracting from 4% to 0.5%, and Media & Entertainment dropping from 4% to -1.5%. Experts attribute these trends to market uncertainties, reduced funding, and restricted marketing budgets.

However, not all companies in these troubled categories saw declines in the growth product metrics.
The top 10% of performers in Technology and Media & Entertainment drove 5% and 5.5% MoM user growth, respectively, outperforming their average counterparts by significant margins.
There is still room for improvement, as the top 10% of companies across all industries averaged a 6% growth rate compared to 2.4% for average players.
For example, Alphabet’s focus on AI and machine learning has kept it at the cutting edge of digital advertising and technology solutions. In 2023, innovations such as enhancements to Google Search with AI-driven results and advancements in its Google Cloud services have driven user growth and maintained its competitive edge.

User Retention Metrics Benchmarks
Retention measures the percentage of users who continue to use a product over time, typically tracked weekly or monthly. Gaining new users is futile if they don’t stick around.

Financial Services saw the largest drop, with week-one retention falling from 51% to 27%. Gaming had the smallest decline, dropping from 26% to 12%.
Retention isn’t a one-size-fits-all metric among product growth metrics. For instance, Media & Entertainment products may consider a user lost if they don’t return for a second visit within a few days, while Financial Services apps may take a longer view.
Over 52 weeks, Financial Services had the best retention, with 15% of users still engaged after a year.
Gaming and Media & Entertainment had the lowest long-term retention, with only 1% of users returning by week 51.

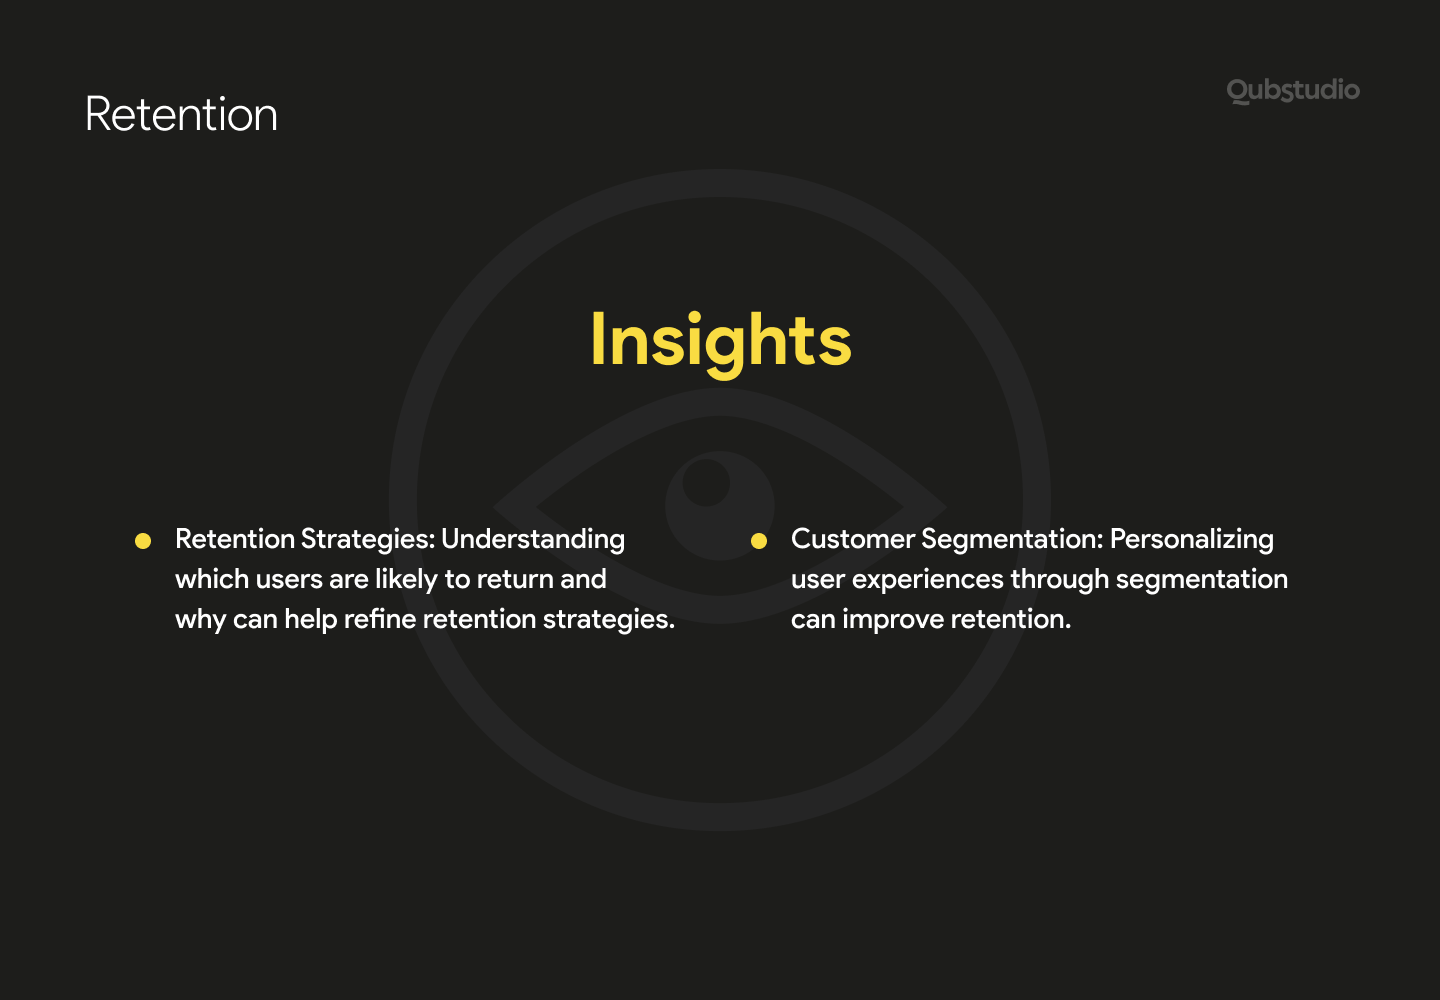
Retention analysis can reveal more than just how well a company retains customers. It can also provide insights into which types of customers are likely to return and how they compare to those who churn, which makes it an important one among other product growth metrics.
For example, GBM, a leading brokerage firm in Mexico, used customer segmentation to create personalized notifications, resulting in higher retention rates.
Another example is PayPal. In 2023, PayPal faced a significant retention challenge, with week-one retention falling from 51% to 27%.
To combat this, PayPal introduced several features aimed at improving user engagement and retention. These included personalized financial advice, enhanced security features, and seamless integration with various e-commerce platforms. By focusing on user experience and providing value-added services, PayPal managed to stabilize its long-term retention rates, with 15% of users still engaged after a year.
User Engagement Metrics Benchmarks
Engagement measures how frequently users perform key actions or events, such as downloads, clicks, and shares.
Analyzing user engagement helps platforms assess whether users find value in a product. Engaged users tend to drive more revenue, especially if their activities lead to outcomes like purchases or subscriptions.
The goal is to foster valuable engagement that converts casual users into returning or paying customers. Product analytics can aid in this process, as illustrated by fintech company QuickCheck, which streamlined its onboarding flow to drive user conversion faster.

E-commerce had the highest engagement, with 58% of users performing five or more events per session. In contrast, Healthcare saw lower activity, with 48% of users performing only one key action per session.

Engagement also varies by industry and day of the week. For instance, digital health services see a spike on Mondays when some providers are closed over the weekend, while users tend to engage more with media and financial services on Saturdays.
Conclusion: How to Succeed in 2024?
Companies across Financial Services, E-commerce, Gaming, Media & Entertainment, Technology, and Healthcare face challenging conditions due to increased competition, less funding, and rapid technological disruptions. Product leaders are at the forefront, dealing with declining retention and complicated user growth.
Top-performing companies drive nearly three times greater user growth than their median counterparts. This gap is most pronounced in Media & Entertainment, where the top 10% of products achieve 5% MoM user growth despite strong headwinds. Additionally, users spend almost three times more time on best-in-class apps and sites than on average ones.
Mobile users far outpaced web users across all industries, driving more site traffic throughout the year. Product builders focusing on mobile-first experiences have a significant advantage.
Retention remains a crucial area for improvement. Product experts need to find new ways to engage and retain users, even in challenging market conditions. Understanding engagement trends and user drop-off patterns will be key in creating value and driving growth.
Transform Your Metrics Into Results with Qubstudio
At Qubstudio, we specialize in setting up metrics and analytics to drive product success. By partnering with Qubstudio, companies can effectively otimize product performance, and achieve sustained growth and success.
For more details on how we can support your business, feel free to reach out to us. Together, we can transform your product metrics into actionable insights and drive your product toward greater success.
