The New Way
of Investing for
Individuals
Web App UI/UX Design
for Investment System
About AURORA
Aurora is an independent system for locating, analyzing, and evaluating investment opportunities. The innovative tool provides data-driven investment ideas and portfolio control that’s easy to use for individual, independent investors.
Aurora covers over 60 markets, 50 indices, 100 manufacturing industries, 6,000 shares, and 15,000 investment funds.

Qubstudio was invited to transform a sophisticated, professional investment system into a comprehensible, accurate, and simple tool for individual investors who don’t have a solid finance background.
It provides a modern analytics tool to make investment decisions based on data that’s easy to read. In the role of fintech UX/UI design agency, our task was to create a user-friendly investment platform design.
DIY for independent investors
Aurora takes advantage of theScreener methodology from Switzerland, analyzes dozens of factors and simplifies the complex financial process of investment decision making.
It empowers investors without a strong financial background effortlessly identify investment ideas, set up your investment portfolio, and simulate your investment plans. Moreover, the pressure and cost of working with financial advisors is now gone. It empowers individuals to gain full control over their finances.


Explore markets, industries, funds and stocks
Aurora presents a simple and clear matrix that makes it easy to analyze data, compare it, and make a data-driven decision. Prior knowledge of a particular stock is not needed.
Global Evaluation System
A quick, simple, and yet accurate estimate of stocks and investment funds.
It combines financial and technical analysis (valuation, profit adjustments,
technical factors, group benchmarking).
Analyze stocks
A thorough asset analysis is provided on one screen. In addition to global evaluation system, Aurora provides more statistics. Each of the four stars represents a segment of financial metrics analyzed. Earnings Revision Trend indicates whether the EPS were ascending or descending during the past seven weeks.

Stock Overview
Valuation Rating indicates growth to the price-earnings ratio that allows individual investors to quickly see which assets are undervalued and which ones are overvalued.
The midterm technical trend indicates how positive or negative the market (buying/selling) tendencies of a stock is.
4-week relative performance measures the performance of a stock relative to its national index (compared to four weeks ago) and gives reliable insights to which stocks investors want.
Sensitivity is a measurement of the Bear Mkt Factor and the Bad News Factor against the world reference.
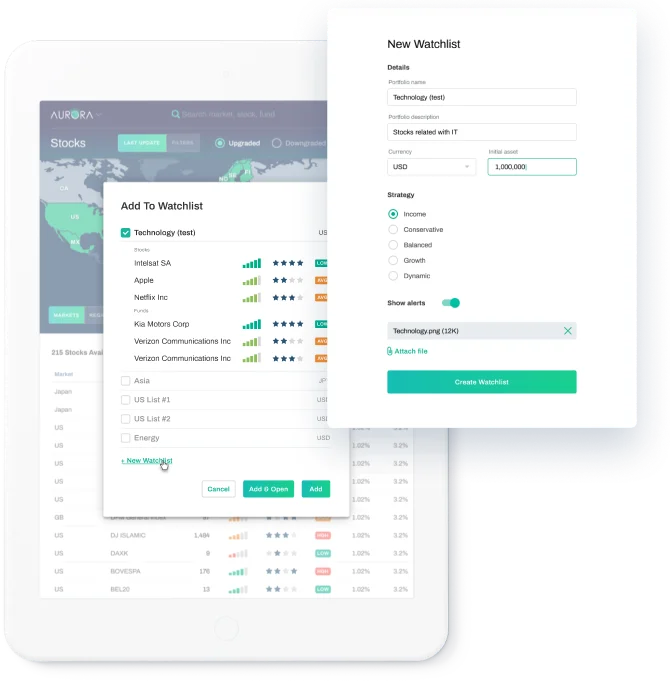
Add your favorite assets to watchlist
Organize your favorite stocks and funds into multiple watchlists to stay on track with all critical updates

Compare stocks and funds
Found stocks and funds you’re interested in? Compare them side by side and never miss a single movement that can influence your investment decision.

Inclusive design
In this fintech UX design, all data is accessible
to people with visual impairments.

RTL
The Aurora is in high demand in the Hebrew-speaking market; that’s why we made it right-to-left friendly and intuitive.


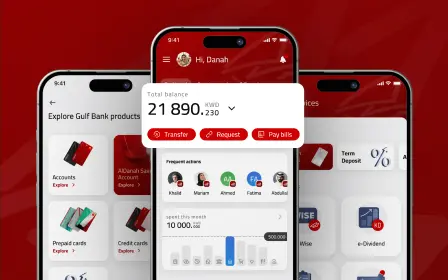
Mobile-first Design Approach

AURORA changes the game rules
in the investment world
Friendly to independent investors, the
investment game will never be the same again.
Stay in tune!
Project summary
Services:
User flows mapping
Information Architecture
Wire-framing and Prototyping
User Interface Design
Product management
Duration:
Team:
Project Manager
UX Designer
Product Manager
Business Analyst